Plinko Probability
|
|
Back to HTML5 Version |
Topics
- Probability
- Histograms
Description
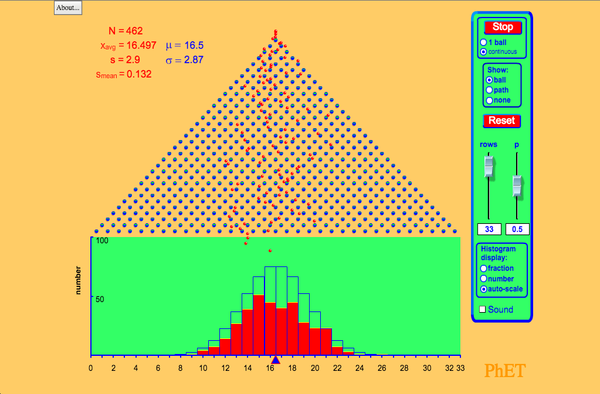
Drop balls through a triangular grid of pegs and see them accumulate in containers. Switch to a histogram view and compare the distribution of balls to an ideal binomial distribution. Adjust the binary probability and develop your knowledge of statistics!
Sample Learning Goals
- Predict the bin where a single ball might fall
- Repeat trials of 100 balls and compare the outcomes
- Count the number of balls in a bin and relate that to the probability of falling in that bin
- Compare and interpret empirical and theoretical statistics
- Apply the plinko simulation as a model to other scenarios where there are weighted statistics
Standards Alignment
Common Core - Math
7.SP.C.5
Understand that the probability of a chance event is a number between 0 and 1 that expresses the likelihood of the event occurring. Larger numbers indicate greater likelihood. A probability near 0 indicates an unlikely event, a probability around 1/2 indicates an event that is neither unlikely nor likely, and a probability near 1 indicates a likely event.
7.SP.C.6
Approximate the probability of a chance event by collecting data on the chance process that produces it and observing its long-run relative frequency, and predict the approximate relative frequency given the probability. For example, when rolling a number cube 600 times, predict that a 3 or 6 would be rolled roughly 200 times, but probably not exactly 200 times.
HSS-IC.A.2
Decide if a specified model is consistent with results from a given data-generating process, e.g., using simulation. For example, a model says a spinning coin falls heads up with probability 0.5. Would a result of 5 tails in a row cause you to question the model?
HSS-ID.A.1
Represent data with plots on the real number line (dot plots, histograms, and box plots).
HSS-ID.A.2
Use statistics appropriate to the shape of the data distribution to compare center (median, mean) and spread (interquartile range, standard deviation) of two or more different data sets.
Version 2.02
Keywords
Teacher-Submitted Activities
| Title |
|
|
Authors | Level | Type | Subject |
|---|---|---|---|---|---|---|
| Probability Plinko |
|
beki toussaint | HS | Lab | Mathematics | |
| Alignment of PhET sims with NGSS |
|
Trish Loeblein | HS | Other | Earth Science Chemistry Biology Physics |
|
| How do PhET simulations fit in my middle school program? |
|
Sarah Borenstein | MS | Other | Biology Earth Science Physics Chemistry |
|
| CCSS Math Alignment with Sims |
|
Amanda McGarry | K-5 HS MS |
Other | Mathematics | |
| MS and HS TEK to Sim Alignment | Elyse Zimmer | HS MS |
Other | Biology Chemistry Physics |
||
| 플린코 확률 SIM 사용설명서 | 이화국(Wha Kuk Lee) | MS HS |
CQs Demo Lab |
| Windows | Macintosh | Linux |
|---|---|---|
|
Microsoft Windows XP/Vista/7/8.1/10 Macromedia Flash 9 or later
|
OS X 10.9.5 or later Macromedia Flash 9 or later
|
Macromedia Flash 9 or later
|
| Design Team | Third-party Libraries | Thanks To |
|---|---|---|
|


